Results and sample work
Client names stay confidential and the numbers come straight from the ad platform. Below the case study is a full sample brand package.
How a national CPG pantry brand cut Walmart ad spend 33% and raised ROAS 78%
A national pantry staples brand had been running Walmart Sponsored Search with an outside agency for over a year. Spend had crept up to roughly $6,700 a week while return on ad spend sat near 3.4x. We took over the account on July 5, 2026, rebuilt it, and within two months it was producing more revenue and more orders on a third less spend.
The situation
Weekly spend had climbed from about $4,200 in January to over $9,300 by late February without a matching lift in results. By June the account was spending $6,700 to $7,350 a week at a 3.1x to 3.6x return. Broad, overlapping campaigns competed with each other for the same searches and a long tail of low-intent keywords drained budget.
What we changed
- Rebuilt campaigns around buyer intent, separating branded, category and discovery traffic
- Split exact-match campaigns by product so each item gets its own budget and bids
- Cut low-intent, low-converting search terms that had been draining budget for months
- Moved budget to the keyword groups and items producing the strongest return
- Reset bidding so spend scales with performance instead of running on autopilot
Before vs after
9 weeks after takeover (weeks of Jul 6 to Aug 31, 2026) vs the 8 weeks before (May 4 to Jun 22, 2026)
| Metric | Before | After | Change |
|---|---|---|---|
| Weekly ad spend | $6,696 | $4,464 | -33% |
| Weekly ad-attributed revenue | $22,425 | $26,558 | +18% |
| ROAS | 3.35x | 5.95x | +78% |
| Weekly orders | 4,047 | 4,716 | +17% |
| Cost per order | $1.65 | $0.95 | -42% |
| Average cost per click | $0.90 | $0.44 | -51% |
| Weekly impressions | 1.08M | 1.81M | +67% |
| New-to-brand orders | 41% | 45% | +4 pts |
Best week on record (week of Aug 10, 2026): $32,959 in ad-attributed revenue and 5,928 orders.
Walmart Connect Sponsored Search data, 14-day attribution. Transition week (Jun 29) excluded. The chart runs through the week of Aug 10 because later weeks were still collecting attributed sales when this data was pulled. The before/after table includes all 9 weeks. Brand name withheld at client request.
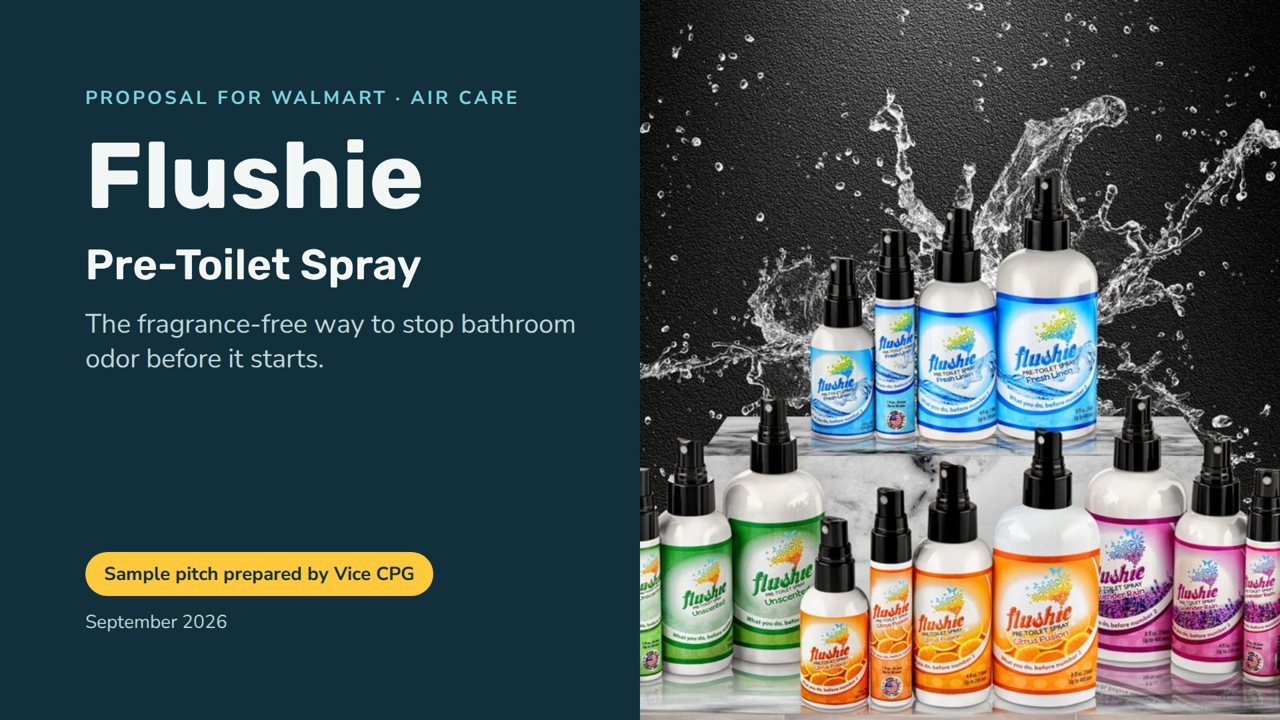
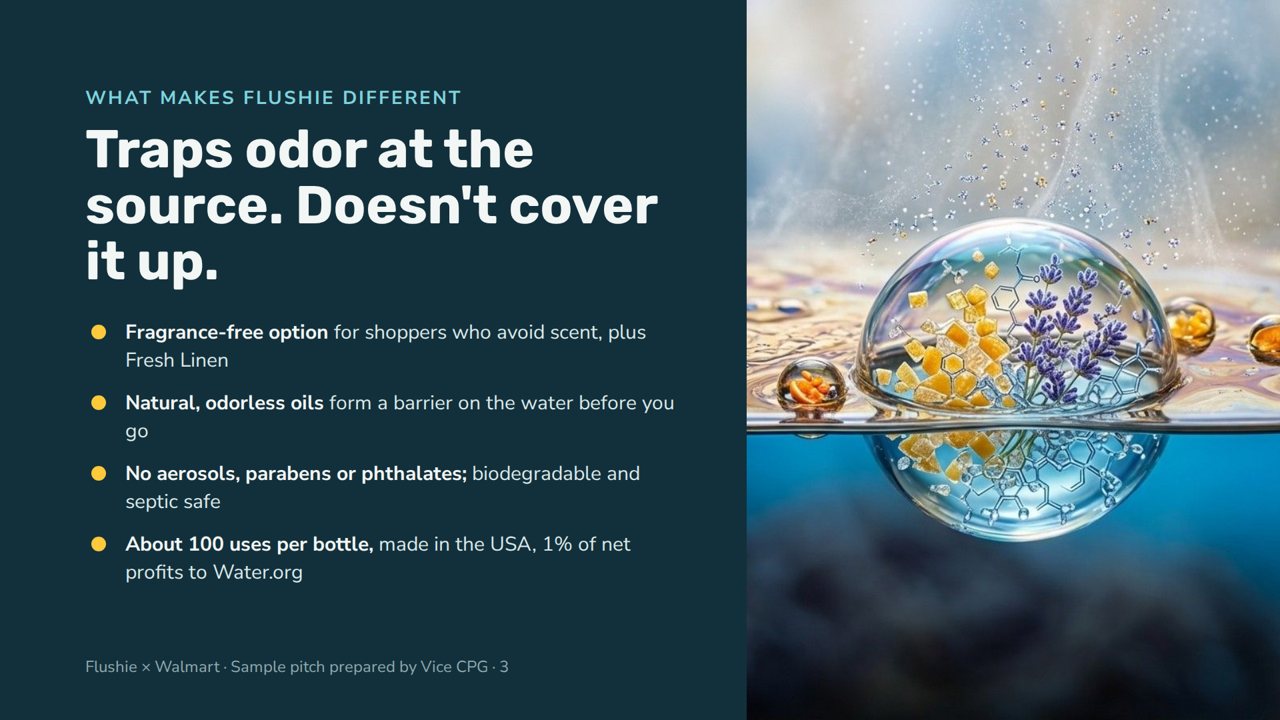
Sample brand package: Flushie
We built a complete Walmart package for Flushie Pre-Toilet Spray to show what brands get: a 10-slide buyer deck, a one-page sell sheet and an AI visibility report.
- Deck written for the Walmart Air Care buyer
- Sell sheet with items, pricing and proof
- Flushie ranks #1 in all 5 AI engines for “best unscented poop spray”